DrBourse
If you don't Ask, You don't Get.
- Joined
- 14 January 2010
- Posts
- 906
- Reactions
- 2,176
Don’t think anybody here in ASF is interested in the DMI..
Regardless of the ‘here and now’, who knows, in the future someone new may realise how valuable the DMI actually is.
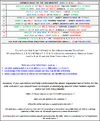
In the original ‘Rules for the DMI Indicator’ (below) I decided to show only 5 of the old combinations/signals to watch out for.
When I published that Shortened Version I was unsure what the ASF Members response would be.

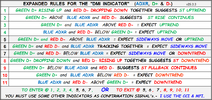
Recently a few posters have asked questions that have prompted me to release an ‘Expanded Set of Rules for the DMI Indicator’.
The following ‘Expanded Set of Rules for the DMI Indicator’ has 11 combinations/signals.

You will note that Rules 1 & 8 refer to the indicator moving ‘Up or Down’.
Whereas Rules 2, 3, 4, 5, AND Rules 7, 9, 10 & 11 refer to the indicator as ‘Above or Below’.
And for Rule #6 see the Other Rules below (2 & 3)
There are a few 'Other Rules', such as: –
1 consider applying Rule 1 or 8, to Rules 2, 3, 4, 5, AND Rules 7, 9, 10 & 11,
2 positioning of the colours carries weight, are they Top, Middle or Bottom,
3 which colours are Above or Below the 25 Centreline, yes the DMI has a Centreline.
There are more, but each one would take a very lengthy explanation – I may reveal more of these rules from many years ago (if I can remember them all).
However, if you can follow and fully understand the above ‘Expanded Set of Rules for the DMI Indicator’ you should have no trouble in identifying several other hidden signals.
Cheers.
DrB.
Regardless of the ‘here and now’, who knows, in the future someone new may realise how valuable the DMI actually is.
In the original ‘Rules for the DMI Indicator’ (below) I decided to show only 5 of the old combinations/signals to watch out for.
When I published that Shortened Version I was unsure what the ASF Members response would be.

Recently a few posters have asked questions that have prompted me to release an ‘Expanded Set of Rules for the DMI Indicator’.
The following ‘Expanded Set of Rules for the DMI Indicator’ has 11 combinations/signals.

You will note that Rules 1 & 8 refer to the indicator moving ‘Up or Down’.
Whereas Rules 2, 3, 4, 5, AND Rules 7, 9, 10 & 11 refer to the indicator as ‘Above or Below’.
And for Rule #6 see the Other Rules below (2 & 3)
There are a few 'Other Rules', such as: –
1 consider applying Rule 1 or 8, to Rules 2, 3, 4, 5, AND Rules 7, 9, 10 & 11,
2 positioning of the colours carries weight, are they Top, Middle or Bottom,
3 which colours are Above or Below the 25 Centreline, yes the DMI has a Centreline.
There are more, but each one would take a very lengthy explanation – I may reveal more of these rules from many years ago (if I can remember them all).
However, if you can follow and fully understand the above ‘Expanded Set of Rules for the DMI Indicator’ you should have no trouble in identifying several other hidden signals.
Cheers.
DrB.


