Australian (ASX) Stock Market Forum

What I'm hearing is, if the hike is 75bp the market will most likely react to the upside and if it's 100bp then react to the downside. Just what people are saying.
I think that if the hike goes to 100bp the market will react to the upside
and If it's 75bp the Market will find new lows

I have no charts to measure any "Feelings and Inclings"

DYOR

XYZ Yacht.GIF
 
However I have often found that the initial response on FED announcements is often WRONG in the first instance
Go Figure?
We must be all working from different Timetables and Charts
Don't they all Know by now?
"Everybody Wins in the Long Term"
HMAS  Ship of Fools.gif
 
What I'm hearing is, if the hike is 75bp the market will most likely react to the upside and if it's 100bp then react to the downside. Just what people are saying.
I would have thought that it would be the other way around.
 
I think that if the hike goes to 100bp the market will react to the upside
and If it's 75bp the Market will find new lows
I would have thought that it would be the other way around.

Yes that post was a spur-of-the-moment quickie. I was actually commenting on the $SPX/SPY part of @ducati916 's post. I've done this before, ie rushed a post, I promise to be more careful in the future.
 
I would have thought that it would be the other way around.
Yes that post was a spur-of-the-moment quickie. I was actually commenting on the $SPX/SPY part of @ducati916 's post. I've done this before, ie rushed a post, I promise to be more careful in the future.
What I'm hearing is, if the hike is 75bp the market will most likely react to the upside and if it's 100bp then react to the downside. Just what people are saying.

Rushed or not, it may be correct.

A 75 bp rise may calm the market whereas a 100 bp one may in fact spook it.

gg
 
Last edited:
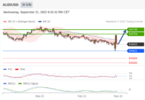
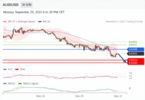
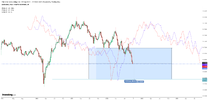
Interesting thoughts on the Feds rate hike, producing a mixed bag. Straight up and down in quick sensation with sentiment pointing south. AUD sits leveled out on lows. With more expected today, Analyst suggest a rebound north off pivot point 0.6621 fighting for highs toward 0.6726. I find this hard to fathom, with Inflation and Interest rate USD pressure placed on the AUD looking for further down turn below 0.6621...This all depends on how the USD reacted to the US hike?

The RSI is below 50. The MACD is negative and above its signal line. The configuration is mixed. Moreover, the price is trading under both its 20 and 50 period moving average (respectively at 0.6663 and 0.6674).

1663795744343.png
 
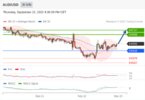
Can the AUD gain enough confidence for some upside to prevail today. The S&P Global Manufacturing, Composite, Services PMI Flash are in today for SEPT. They test positive and in the green but is it enough to get the AUD over the line. Analysis suggest take a long position at 0.6616 support looking for 0.6717 sounds doable, interesting to see how the AUD fairs. Alternative Scenario below 6616...

The RSI is above its neutrality area at 50. The MACD is above its signal line and positive. The configuration is positive. Moreover, the price is above its 20 and 50 period moving average (respectively at 0.6641 and 0.6624).

1663882048602.png
 
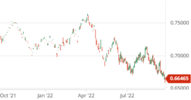
However, the longer term trend is down! down! Prices are down! as shown in this chart of Dec 22 futures.
Screenshot 2022-09-23 at 07-36-31 Australian Dollar Dec '22 Futures Price - Barchart.com.png

I'd find it really hard to trade against the trend, even on a short term basis. Yes, the down trend has to stop eventually, but I'll wait until there is a really good buy signal before changing my position.

KH
 
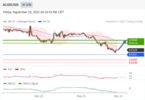
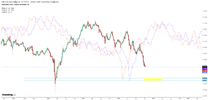
AUD might be looking at a rebound towards 0.6599. Due for a correction north, no real news to support this theory should trend continue south. The downside breakout of 0.6497 would call for 0.6460 and 0.6439. Suggested pivot point and support stands at 0.6497?...

The RSI is below its neutrality area at 50. The MACD is above its signal line and negative. The configuration is mixed. Moreover, the price stands below its 20 and 50 period moving average (respectively at 0.6548 and 0.6594).

1664147090258.png
 
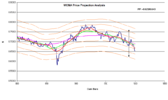
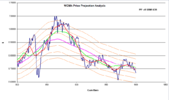
Expect only a feeble rebound. My 2c LOWER..... 0.623/0.643 range on the weekly chart projection. Monthly projection range is 0.608/0.638. So we have overlapping ranges in these 2 timeframes. When it approches 0.643 will re analyse , but ultimately price and momentum will hopefully tell us. For now I hold my USD especially since SPX and indices look so weak.
 

Attachments

  • 2022_09_26_09_55_36_Price_Projection_Analysis_Version_2_MA_Trend_and_Strength_Google_Sheets.png
    2022_09_26_09_55_36_Price_Projection_Analysis_Version_2_MA_Trend_and_Strength_Google_Sheets.png
    9.9 KB · Views: 9
  • 2022_09_26_09_54_51_Microsoft_Excel_FT_CCI50RSI_System_ST2_Dual_CCI_TDI_wma_RSI_CD_6FL.png
    2022_09_26_09_54_51_Microsoft_Excel_FT_CCI50RSI_System_ST2_Dual_CCI_TDI_wma_RSI_CD_6FL.png
    18.8 KB · Views: 8
  • AUDUSD Monthly PP.png
    AUDUSD Monthly PP.png
    7.4 KB · Views: 5
  • AUDUSD Monthly_PP_Range.png
    AUDUSD Monthly_PP_Range.png
    25 KB · Views: 6
Last edited:
Expect only a feeble rebound. My 2c LOWER..... 0.623/0.643 range on the weekly chart projection. Monthly projection range is 0.608/0.638. So we have overlapping ranges in these 2 timeframes. When it approches 0.643 will re analyse , but ultimately price and momentum will hopefully tell us. For now I hold my USD especially since SPX and indices look so weak.
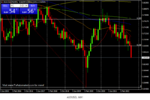
The downside prevails as long as 0.6496 is resistance. Analyst giving in to the downside pressure on the AUD, I concur Monthly and Weekly Chart showing more and more dominance of downside prevailing as the days go bye. May see some upside into next week. Falling back into lows of Feb 2020, Despite the depression alternative scenario Above 0.6496, look for 0.6531 and 0.6553.

The RSI is below 50. The MACD is negative and below its signal line. The configuration is negative. Moreover, the price is trading under both its 20 and 50 period moving average (respectively at 0.6479 and 0.6500).

1664228743948.png

1664228823396.png
 
Interestingly 4 year Nominal cycle using 100 week offset calling for sub 60c ultimately. Sort of lines up with the 0.608 expected from the monthly dynamic cyclesz1szr.png
 
Interestingly 4 year Nominal cycle using 100 week offset calling for sub 60c ultimately. Sort of lines up with the 0.608 expected from the monthly dynamic cyclesView attachment 147338
I’m just wondering how far the Aussie can fall going forward to about Christmas Day which is special for me what with family getting together and presents.

1665077169730.jpeg

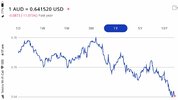
It’s lost 15% this year.

How low can it go given the mess the USA is heading towards, before recovering.

gg
 
I’m just wondering how far the Aussie can fall going forward to about Christmas Day which is special for me what with family getting together and presents.

View attachment 147771

It’s lost 15% this year.

How low can it go given the mess the USA is heading towards, before recovering.

gg
Should meet just under 60, no other downward cycle projections thereafter. Basically will follow SPX. "It's all the same market atm"

z5uaw.png
 
With the RBA choosing to slow the pace of rate hikes last week, Friday’s hot NFP report looks like it may have opened the door for the Australian and US rate differential to accelerate.

All trading carries risk, and this week’s US CPI data will also likely have a big say in things. However, this could weigh heavily on AUD/USD as the pair currently looks to be attempting a break below the sideways range it traded in over the last 2 weeks.
 
Should meet just under 60, no other downward cycle projections thereafter. Basically will follow SPX. "It's all the same market atm"

View attachment 147863
Got close!
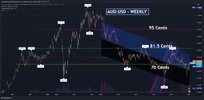
Here's the past 20 years or so:
1674613169271.png
A massive AUD fall early into 2020's covid's pandemic was followed by a recovery over the next 12 months.
Covid jitters and global market pessimism sank our dollar again into late 2022, before a strong recovery got underway in mid-October.
With China possibly returning to pre-pandemic manufacturing levels our mining sector may well prop up the dollar as this year rolls along. I won't be surprised to see 81.5cents hit towards year's end.
 
Got close!
Here's the past 20 years or so:
View attachment 152116
A massive AUD fall early into 2020's covid's pandemic was followed by a recovery over the next 12 months.
Covid jitters and global market pessimism sank our dollar again into late 2022, before a strong recovery got underway in mid-October.
With China possibly returning to pre-pandemic manufacturing levels our mining sector may well prop up the dollar as this year rolls along. I won't be surprised to see 81.5cents hit towards year's end.

gg
 
So, what's happened now? Has the bubble burst? Or is it intact? I'm devoid of comprehension today......
 
So, what's happened now? Has the bubble burst? Or is it intact? I'm devoid of comprehension today......
This is my take on it. Btw I sold all my Aussie Gold mining shares (AGMS) a while ago, missing recent tops, but making a good profit anyways. I do have a US outfit in my portfolio.

So you are an overseas investor in AGMS and you buy X amount when AUD/USD is 60+c. last year, it costs you 60X

This year the AUD/USD is 70c. It will cost you 70X to buy X amount of shares.

Unlike Gold, AGMS are outfits subject to the vagaries of business and mining ... wages, weather, incompetent management, theft, inflation in costs, gold price, forex, forward sale price, contracts, increased rates on borrowings, and plain bad luck.

So say your AGMS has done well and X has increased is now 2X.

Bought at 60X

Present value 140X

Sell and buy a GMS in your own currency if you fell Gold will continue to appreciate.

AGMS falls as people sell, and by people I mean the big Kahunas not folk on ASF, so the price falls.

gg
 
Top