Australian (ASX) Stock Market Forum

Futures trading journal - GB

Taking a small loss. It should have taken off just then.

-5.


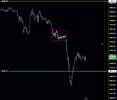
On review, this was a ledge or bear flag (pink). Seen on 20m TF. My rule is: The bigger the fall leading to the pause in downwards momentum, the bigger the volatility swings need to be in order for a reversal to happen.

The first swing up was ok (first yellow line), but it was followed by a very flat swing up (2nd yellow line). The big run up from the previous day was the give away. There was reasonable buying during the ledge but I've seen that before - that's the bull trap - luckily I saw it in time.

x.png


No instrument will do this following a big run up. Not very often anyway.

x.png
 
Later on, I noticed the potential for a V-bottom and got 33 ticks. V-bottoms can be difficult to trade due to the fact that we don't get to see the stereotypical Wyckoffian reversal patterns (punches and counterpunches of bulls vs bears). It just stops and reverses.

V-bottoms can be climactic with a single high volume bar. These usually occur after a 'waterfall pattern' - ie. a smooth, accelerating downwards curve. These are great to trade when the price falls very quickly into a level you've identified earlier (like an imbalance or obvious volume profile node from the run up that preceded it). Quick in and out, aiming for 50% retrace of the fall.

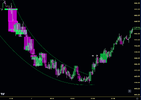
V-bottoms can also be signalled when the momentum slows a bit and there's a volatility contraction. See below. Its convex curve is different to the concave shape of the 'waterfall'. You can go long at the first green bar with buying volume. This type of V-bottom tends to continue up a long way with low volatility. Not always, but often. Hold until momentum peters out.

The first break upwards through the curved line didn't have any strength to it, so I went long at the arrow. In this particular case I exited early because the buying volume in the follow through was weak. Candlevolume chart shows this weakness, even as it moves up. A relief rally.


x.png
 
Last edited:
+25

Wish they were all that easy. Very clear buying, absolutely no resistance.

Will look to hop back in if it continues.
 
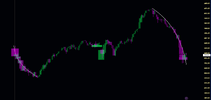
Classic examples from Friday's session. ES.

A] Curved white line on the left shows slowing momentum with contracting volume and volatility.
B] Curved white line on right shows accelerating momentum with increasing volume and volatility.

Long entry on A] is best when buying has been shown to return to the market. A change of character or break of structure with volume to support it.
Long entry on B] is best during a plumetting, high volume and high range red bar when it coincides with a level.

A] Often held until momentum slows.
B] Mean reversion trade. Hold for n-bars or 50% retrace of the drop.
C] (not shown) A complex bottom. Identify stopping volume and watch to see if the low of the bar that printed the stopping volume holds.
D] (not shown) It's far more common for tops and bottoms to be messy. But exhaustion and interest can still be identified in such cases.


x.png
 
Last edited:
BE

L 4550.25

The market has definitely changed in the last 2 days, after behaving the same way for 6 months or so. It may signal a bear about to appear on the scene, or it may return to normal.

-6 silly trade.
 
Last edited:


Write your reply...
Top