- Joined
- 17 August 2006
- Posts
- 7,961
- Reactions
- 8,707

Just for the point of the exercise and trying to clarify how I might use some of the "Volume" data which is posted.
The data in itself provides nothing more than questions as to whether any further research may be warranted.
I am currently fully invested so I am not particularly looking for more "Specs with potential", but that was what I had in mind when originally posting the data which I myself would often look at.
With that all said, below will hopefully be a very rough and quickly set up spreadsheet with today's "Volume" Stocks under approx $200 Million Market Cap to demonstrate basically what I am babbling about.
Personally I was/am more interested in the VERY low Market Cap Stocks of less than $20 million, but that is up to each punter to determine their areas of interest.
So in the rough look Chart below, I initially look for various things of interest:
Cash on hand;
Cash on hand in relation to Market Cap;
Charts (I like charts that have been punished but showing some signs of possible revival off recent lows);
Sector (I like Mining Stocks but not Financial or Energy Specs);
Volume in relation to normal and market cap (Increase in Volume relative to price action is always a tell tale of something going on);
News/Announcements which precede or post"cede" Volume or price action.
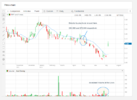
As an example today RC1 chart went ballistic of recent lows off the back of some "apparently" stellar RC drill results. At face value the results look fantastic, but a closer look indicates (to me), that the strikes are VERY "nuggetty"
Nuggetty Gold is obviously not a bad thing, but many times the follow up drilling around nuggetty deposits is far less spectacular.
Couple that, with the price spike coming off an obviously distressed Chart, then I would put a strike through RC1 with no further research at this point, or at least till the initial Chart euphoria wears off and perhaps some more results come to hand.
That is just one example, but in reality, it took me 20 seconds to cull that Stock from any further current research, and that is the concept of how I would use the data posted. Others may or may not find the data useful at all, particularly if Specs are of little interest.
Cheers, and hopefully that helps or makes some sense. (Please click to expand below. Stocks either get a NAH or a possible further research if showing signs of potential)
Yeah I agree D-4, High Range High Volume "bars" are definitely a time to get nimble for a possible change of direction. Ultra high Volume even more so, whether at tops, or bottoms.i normally look at spikes in volume as a potential exit ( or reduce ) opportunity if i hold that share

So close to the "Close" but of no use to me for Daily comparisons and more importantly for Weekly comparisons
So close to the "Close" but of no use to me for Daily comparisons and more importantly for Weekly comparisons
I am very sad
I understand your point Captain. I still think updating the list during the day, then doing a Close of Trade would be even better, but unfortunately I still work X amount during the day and my access to a computer can be a bit random (self employed)So close to the "Close" but of no use to me for Daily comparisons and more importantly for Weekly comparisons
I am very sad
Hello and welcome to Aussie Stock Forums!
To gain full access you must register. Registration is free and takes only a few seconds to complete.
Already a member? Log in here.