Australian (ASX) Stock Market Forum

April 2025 DDD

Joined
13 February 2006
Posts
5,389
Reactions
12,522
Screenshot 2025-04-05 at 3.10.59 PM.pngScreenshot 2025-04-05 at 3.13.38 PM.png


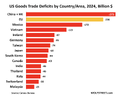
And so now, the US is on the clock: stocks down big means US consumer spending will be down soon. Which means US Federal receipts will begin falling soon. Tariffs up in theory raise revenue for the US government but only if:


  1. US trade partners (China) pay the tariffs effectively and;
  2. The USD rises to offset tariff-related inflation.
The problem is that thus far, China is not reacting as they did in 2018.

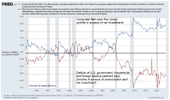
So tariffs are increasingly looking likely to be either or both an inflationary tax on consumers (stagflationary) or a pinch on corporate profits, leading to higher US unemployment, lower receipts and likely a US recession which typically sends deficits up 600-800 bps of GDP, or $1.6-2.2 trillion.

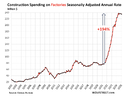
And so the US government is now in a race between the negative hit of all of the above against the ability to reshore and rebuild as fast as possible, with the blow maybe softened somewhat by tariffs.

Screenshot 2025-04-05 at 4.01.19 PM.png

Screenshot 2025-04-05 at 4.07.00 PM.png


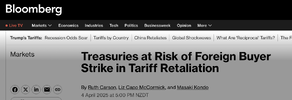
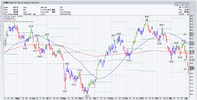
So yields are currently falling driven by the run-to-safety trade that has always operated in the past during equity market sell-offs.


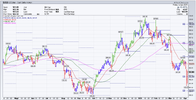
But the USD
Screenshot 2025-04-05 at 4.08.56 PM.png

Makes imports more expensive and then add the tariff effect to that also.

Inflation is, will be, higher. Thereby making UST yields incompatible with selling new debt, unless the Fed steps in to buy it.

So oil:

Screenshot 2025-04-05 at 4.17.33 PM.png

Full:https://www.reuters.com/markets/com...new-challenges-top-oilfield-flags-2025-03-27/

The global shale market and economy cannot survive oil <$65 for long.

The UST market and global bond market cannot survive oil >$85 for long

So oil will have to be kept $65-85 range.

Gold will have to be allowed to be the release valve.

Since gold isn’t used for anything.

The gold/oil ratio, which just broke out is likely going to triple digits in coming years. Mostly via higher gold prices.
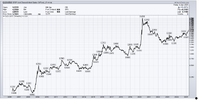
Screenshot 2025-04-05 at 4.24.13 PM.png

Oil News:

Friday, April 4th, 2025

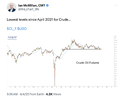
The combined effect of Donald Trump’s import tariffs, OPEC+’s inopportune decision to speed up the unwinding of production cuts and China’s retaliatory actions have wiped off $10 per barrel from global oil prices, with ICE Brent falling below $65 per barrel for the first time since August 2021. Seeing backwardation barely change compared to the beginning of the week, one could assume that US tariffs are the defining factor for the price change, nevertheless this week will not go down well in the history of oil markets.

OPEC+ Rushes to Unwind Production Cuts. Eight OPEC+ countries that have been moving along with the gradual return of their 2.2 million b/d voluntary cuts unexpectedly agreed to expedite the unwinding of production cuts, boosting output in May by 411,000 b/d, equivalent to three monthly increases.

Trump Surprise Moves Squashes Metal Arbitrage. Whilst many traders expected Donald Trump’s import tariff roll-out to impact metal markets, the non-sanctioning of metals led to shrinking spreads between US and European benchmarks, with Comex gold premia over London futures halving to just $20 per ounce.

China Strikes Back with 34% Tariff Move. Reacting to President Trump’s sweeping tariffs, the Chinese Finance Ministry announced that it would impose additional tariffs of 34% on all goods produced in the US from April 10, concurrently adding seven rare earth minerals to Beijing’s export controls list.

Canada’s TMX Downgrades Export Outlook. Canada’s Trans Mountain pipeline has downgraded its outlook for 2026-2028, pushing out full utilization beyond 2028 with an expectation of 84% throughput this year, largely due to lower-than-expected spot bookings in TMX, a mere 18,500 b/d so far.

Nigeria Picks Shell Executive for Top Oil Post. Nigeria’s President Bola Tinubu appointed Bashir Bayo Ojulari, formerly the country manager of Shell’s (LON:SHEL)operations, as the top executive of the country’s national oil firm NNPC, just weeks before NNPC’s long-anticipated IPO.

Activist Investor Buys Up BP, Shorts Shell. US activist hedge fund Elliott Management, concurrently to its reforming drive in embattled oil major BP (NYSE:BP),has built up a huge short position in BP’s competitor Shell (LON:SHEL), equivalent to about 0.5% of Shell’s total worth.

IMF Warns of Global Tariff Fallout. The International Monetary Fund warned that US import tariffs and reciprocal measures triggered by them pose a ‘significant risk’ to the health of the global economy, potentially indicating that its 3.3% global GDP growth forecast for 2025-2026 could be soon cut lower.

World’s Top Miner Mulls Coal Spin-Off. Australia’s mining giant BHP (ASX:BHP) has reportedly considered spinning off its iron ore and coal divisions, similar to its previous listing of South32 in 2015, however, the company’s top management as iron ore still accounts for roughly 60% of its profits.

Agricultural Staples Fall Under Trade War Pressure. China’s reciprocal tariffs on the US have triggered a collapse in Chicago wheat and soybean futures as the tariff war puts US exporters at a disadvantage to Brazil, with both commodities set for their biggest weekly drop since November 2024.

Colombia Overcomes Indigenous Oil Riots. Ecopetrol (NYSE:EC), the national oil firm of Colombia, resumed operations at its Rubiales and Cano Sur oil fields, producing 140,000 b/d or 18% of the country’s total output, after a deal with Indigenous associations after weeks of riots that debilitated operations.

Iraq Doesn’t Want To Give Up on Kurdistan. The Iraqi Oil Ministry has reactivatedefforts to find a negotiated settlement with the semi-autonomous region of Kurdistan to resume oil exports from the north of the country, previously failing to convince Erbil that $16 per barrel would be an adequate price.

Kazakhstan Reports Giant Rare Earth Discovery. Kazakhstan’s Industry Ministry announced the discovery of a rare earth metal deposit with an estimated resource tally of more than 20 million tonnes in the region of Karaganda, placing it behind only China and Brazil in terms of prospective resources.

European Gas Stocks Plunge to Three-Year Lows. Natural gas stocks held in EU jurisdictions entered the summer period at their lowest in three years, totalling only 388 TWh of 34% of nameplate storage capacity, aggravated by a speeding up in net withdrawals to 1.02 TWh/d in the second half of March.

Ukraine war:


From NYT:


"The US cannot credibly project conventional power against a near-peer or peer power to stop them from making changes to the global Rules Based Global Order. without taking politically-unacceptable levels of US casualties and Russia and China both know this. So systemic change to the 'Rules Based Global Order' is likely to continue at an accelerating pace."

So forcing Russia and China to term out future UST issues is not going to happen. Forcing China to unilaterally accept tariffs is not going to happen.


Trading this week:

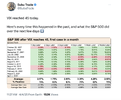
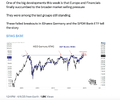
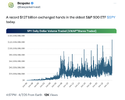
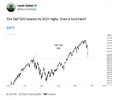
  • Today was even worse than yesterday, with the S&P 500 dropping nearly -6%. The index has shed -10.5% over the past two sessions, marking its worst back-to-back decline since March 2020.
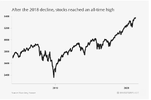
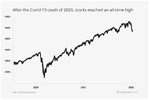
  • Dean points out that declines of this magnitude are extremely rare within two months of a record high. This has only been observed during some of the worst stock market crashes in history, including 1929, 1987, and 2020.
  • It would be foolish to draw a bold conclusion from a sample size of three. That said, $SPX has historically struggled over the next week, but six-month returns have never been negative.
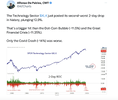
The Takeaway: The S&P 500 tumbled -10.5% in the final two days of the week. Declines of this magnitude are extremely rare within two months of an all-time. This has only been observed during some of the worst stock market crashes in history, including 1929, 1987, and 2020.

Screenshot 2025-04-05 at 4.37.25 PM.pngScreenshot 2025-04-05 at 4.37.40 PM.pngScreenshot 2025-04-05 at 4.38.04 PM.pngScreenshot 2025-04-05 at 4.38.17 PM.pngScreenshot 2025-04-05 at 4.38.33 PM.png

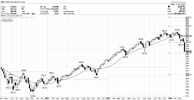
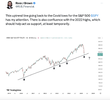
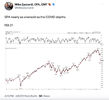
The above chart is uncanny.


Fundamentally, yes stocks could fall a whole lot more quite easily. The main reason being that Trump in his many policy releases has targeted the capital flows as being an issue in the deficits. Markets have lost +/- $2 trillion in market cap. this week out of a $21 trillion foreign capital flow. Lots to go.

The Fed is sitting on its hands. Largely because things are likely to become significantly worse on the inflation and employment fronts and that will be soon. The ISM manufacturing data was horrible.

I have to say as 'tops' go, this has been a really fast one and hard to navigate. Being constantly hedged has been very rewarding this last couple of weeks.


Anyway, over the next few weeks my day job workload is lighter, so I will be able to update more regularly again.


jog on
duc
 
China Strikes Back with 34% Tariff Move. Reacting to President Trump’s sweeping tariffs, the Chinese Finance Ministry announced that it would impose additional tariffs of 34% on all goods produced in the US from April 10, concurrently adding seven rare earth minerals to Beijing’s export controls list.
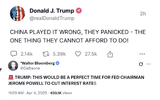
that is NOT panicking that is matching the tariffs and then raising the stakes a little , i would have gone for targeted pharmaceutical ingredients instead of critical minerals but then maybe China is trying to slow military production as a side-effect .

( i can see this and am rubbish at poker )

now i would have thought China just expand it's sales wider internationally and take activity from the US dollar ( less sales to the US ) , lulling the US into overreaching

maybe they are trying to antagonize the US into a public blunder ( retaliate even harder ) i wonder if China is rolling out of bonds into physical gold ( and silver/copper ) during all this

copper will be important soon but ( allegedly ) China already has huge stockpiles of bar-stock

... dominate the world copper trade , perhaps ?
 
So forcing Russia and China to term out future UST issues is not going to happen.
if Russia still holds any treasuries at all more fool them , buy more even dumber there will be a new President in 4 years time , and that one could even be worse

and i would think China will be ( mostly ) letting existing US bond holdings mature ( they hold a heap of Muni bonds as well ) but will China buy more in the future ?

given the current rhetoric i suspect not , maybe they will convert any trade surplus cash , into physical commodities ( corn , oil , gold , etc etc ) and bring it back to China ... or just sell very little to the US ( and stop buying stuff as well )

they had a 'Bamboo Curtain ' decades back they might decide to do that again and force all buys and sells through intermediaries , like Singapore or India ( to G7 nations )
 
I think this chap was posting these as: don't worry all will work out fine.

Screenshot 2025-04-06 at 7.22.29 AM.pngScreenshot 2025-04-06 at 7.22.44 AM.pngScreenshot 2025-04-06 at 7.23.00 AM.pngScreenshot 2025-04-06 at 7.23.13 AM.pngScreenshot 2025-04-06 at 7.23.28 AM.pngScreenshot 2025-04-06 at 7.23.39 AM.png
Screenshot 2025-04-06 at 7.23.51 AM.png
Screenshot 2025-04-06 at 7.24.02 AM.png
Screenshot 2025-04-06 at 7.46.52 AM.png

Screenshot 2025-04-06 at 7.26.25 AM.png

Screenshot 2025-04-06 at 7.51.49 AM.png

The number 1 purpose of Tariffs is to end globalisation and return manufacturing to the US.

Screenshot 2025-04-06 at 7.52.00 AM.png

The second goal of tariffs is to impose taxes on corporate profits if companies decide to import, which forces companies to pay taxes that they might otherwise have dodged, such as Big Pharma and Big Tech that run their profits through Ireland and other financial centers and pay zero income taxes in the US on those profits sheltered overseas. Trump explained that yesterday, which may be why Apple tanked 9% today.

Tariffs are bad for stocks because they’re tax on corporate profit margins.

We know that, based on how stocks got hit in 2018 through the tariffs finally imposed then, and the S&P 500 went down 20%.

Tariffs are bad for stocks because they extract taxes from companies, many of which would otherwise not pay income taxes in the US. Hence lower stock prices. The market understands that now just fine, despite the relentless BS in the media that tariffs are sales tax for consumers.

Passing on higher costs to consumers is very hard. It tends to cause sales to plunge, as Americans hate higher prices. And then, with sales dropping, the price increases are rolled back.

So we have a sea change.

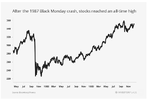
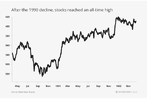
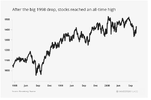
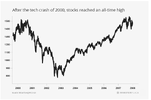
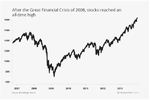
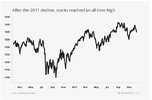
Does a sea change mean that the previously identified 8 charts have anything to do with the current chart?

Now add in the issue around the deficits.

What was the deficit in 1987? In 2000?

In fact as the 2000 chart reached its former high, we then went into 2008. On a macro basis, why was that? The year 2000 is when China joined the WTO and US manufacturing was hollowed out creating the 'Rust Belt' and the NINJA mortgages started to appear (No Income, No Job, No Assets). Bernanke and the Fed were implicit.

Currently liquidity has been provided through any number of nefarious ploys. This is fast ending.

The choice is:

Asset prices crash a la 1929-1934 or
The Fed inflates providing the liquidity to bring the manufacturing base back to the US. VERY inflationary and not a quick fix.

Employment.

Deficits soar when unemployment increases. Nothing like a crash to ratchet up unemployment, with compressed margins and a need for capital spending.

The Fed are not coming to the party currently.

That means the risk of this spiralling out of control rises significantly.

Capital flows have also been targeted by the Trump administration. That is, take your money home. This = falling stock prices and a falling USD. Foreign investment = +/- $21 Trillion. Market is down +/- $2 Trillion.

Tariffs generally should drive a stronger USD. A too strong USD also causes sales of assets.

Oil.

The US Shale oil industry needs higher, not lower oil prices. Oil prices are falling precipitously. Too low for too long and production is shuttered. With shale, some of that never comes back.

Tell me again that your charts tell you the story and that the future will look just like the past.

The US is in decline. Like most Empires, it is past its sell-by-date. Rotten from within. Whether it can rise again remains to be seen. However that will not be an overnight thing.


jog on
duc
 
So the US futures are bouncing all over the place.

The reason: short covering.

We are now in a bear market. Bounces at this point in time are short covering only. The value guys are nowhere near to buying this market or individual issues.

What Trump has just about succeeded in doing is triggering the recession that the Fed, Treasury, et al have been managing to delay for about 2yrs through tricky liquidity plays.

The employment data will start to reflect this reality.

The muted run-to-safety, ie. longer dated duration, is because the savvy know that the only way out of this mess is outright monetization by the Fed of the deficits which will explode higher once employment collapses.

This is not your covid crash nor any crash that anyone alive has seen.

This is a 1930's crash until the Fed steps in to buy everything. The longer they wait, the worse it gets. The sign will be UST paper breaking and the run-to-safety trade also collapsing. Just to be clear, that does not mean cutting back to ZIRP, it means the Fed capping rates a la 1949 and buying everything.

Obviously the USD collapses as inflation takes hold.

To manage the +/- $220 Trillion in liabilities, more the $38 Trillion in public debt, look for a Gold revaluation. A revaluation will be supported by BRICS.

Bessent got the order wrong: first you restructure your debt, then and only then do you reshore. Trying to reshore prior to restructuring the debt is the mistake.

Trump should know better, after all he has been bankrupt at least 3 times.

Credit spreads will start to widen. That signals the start of the Treasury market breaking. That's where the Fed will become involved. No Treasury market, no floating US Treasury debt.

It's already happening:


Screenshot 2025-04-07 at 3.35.09 PM.pngScreenshot 2025-04-07 at 3.35.46 PM.png

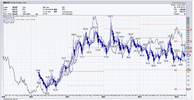
The 160 level on $MOVE is when the sh*t really hits the fan.

I would say a week, but it may be faster than that.

As this is my 9'th or 10'th crash as measured by those previous charts, I would say we are just getting warmed up. The bounce 2 weeks ago was the clue. It was so weak that it could only be shorts taking profits.

If you remember 2020, Central Banks around the world became involved. Until AT LEAST that happens, this is a nothingburger.


jog on
duc
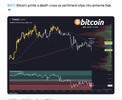
 
Screenshot 2025-04-08 at 1.35.15 PM.pngScreenshot 2025-04-08 at 1.36.41 PM.pngScreenshot 2025-04-08 at 1.36.55 PM.png


Of course we have had a 3 day decline now.

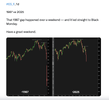
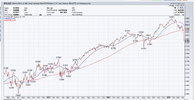
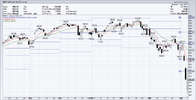
Now the SPY closed underwater last Friday, which meant that it would always gap lower on Monday (today). When indices close underwater, gap down, almost invariably, they trade higher. It is a VERY bad sign if they then trade lower.


Screenshot 2025-04-08 at 1.33.21 PM.png

So sure enough, gap lower, trade higher.

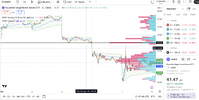
Screenshot 2025-04-08 at 1.34.34 PM.png

However, we closed below the POC. (black horizontal line). Not a good sign. That is selling resistance. At the highs, there was little to no volume looking to get long.

This looks like a typical bear market short covering. Vicious upmove that found little to no new longs wanting to buy long. The late day rally failed at POC.


Screenshot 2025-04-08 at 1.47.13 PM.pngScreenshot 2025-04-08 at 1.47.47 PM.png

MAGS looking worse than non MAG7 stocks.


at%205.03.36%E2%80%AFPM_01JR912M6MS6JPV71FNYSSM0JQ.png
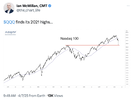
72.png Today's Chart of the Day was shared by Ian McMillan (@the_chart_life).

  • The Nasdaq 100 ($QQQ) closed slightly higher today by +0.2% after clawing back a -4.8% loss. Despite today's reversal, $QQQ remains -21.5% off its February peak on a closing basis.
  • Ian pointed out that $QQQ found support at the prior cycle highs before rebounding today. $QQQ peaked at this level in Q4 2021 before entering into a multi-month bear market.
  • Bull and bear markets are more subjective than the media's definition of a 20% advance or decline. However, if the Nasdaq loses its prior cycle highs, it will further confirm that a new bear market is underway.
The Takeaway: The Nasdaq 100 ($QQQ) closed slightly higher today after successfully retesting its 2021 highs. If $QQQ loses this pivotal level, it will be further evidence that a new bear market has begun.


Screenshot 2025-04-08 at 1.52.14 PM.pngScreenshot 2025-04-08 at 1.52.33 PM.pngScreenshot 2025-04-08 at 1.52.46 PM.pngScreenshot 2025-04-08 at 1.53.12 PM.pngScreenshot 2025-04-08 at 1.53.41 PM.png


jog on
duc
 
Screenshot 2025-04-09 at 8.01.24 PM.png

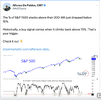
  • The S&P 500 closed lower by -1.6% after being up more than +4.0%this morning. It's not bullish seeing bounces fade so quickly.
  • As of today, only 12% of stocks in the S&P 1500 are above their 200-day moving averages, marking the lowest reading since Covid.

  • While breadth is extremely weak, Alfonso points out that reclaiming the 15% threshold has historically been a solid buy signal.
The Takeaway: Breadth has reached washout levels, but the coast isn't clear until this indicator turns higher and reclaims 15%. Check out the full post for more on this signal.

Screenshot 2025-04-09 at 8.03.13 PM.pngScreenshot 2025-04-09 at 8.03.33 PM.pngScreenshot 2025-04-09 at 8.03.59 PM.pngScreenshot 2025-04-09 at 8.04.28 PM.pngScreenshot 2025-04-09 at 8.05.10 PM.png


Communicating.

Inverse bird.

Anyone feeling brave?

jog on
duc


Write your reply...
Top