- Joined
- 28 May 2020
- Posts
- 6,795
- Reactions
- 13,082
Cathy Wood offers an informative and interesting look at the coming year, from the 30:00 minute mark.
00:20:04 – Cathie’s Market Summary
00:24:04 – Fiscal Policy
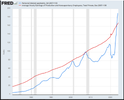
00:24:07 – Total Public Debt Outstanding vs. GDP
00:26:03 –Total Public Debt Outstanding Divided by GDP
00:27:05 – Monetary Policy
00:27:08 – M2 Money Supply vs. CPI: Year-over-Year
00:28:01 – Yield Curve 10 Year Treasury Yield Minus 2 Year
00:29:10 – 10 Year Yield Minus 3 Month Yield: Consecutive Days Inverted
00:30:14 – Recession Probability – Federal Reserve Bank of New York
00:31:14 – Economic Indicators
00:31:19 – The Conference Board’s Leading Economic Index
00:31:39 – Total Continuing Jobless Claims
00:32:33 – Temporary Help Employment vs. Total Employment
00:34:01 – Piper Sandler Charts
00:38:33 – Market Signals
00:38:37 – US Dollar Index (DXY)
00:39:17 – Bloomberg Commodity Index
00:39:56 – Metals/Gold Ratio vs. US 10 Year Treasury
00:41:03 – Gold to Oil Ratio – Historical Chart
00:42:23 – Cathie’s Conclusion
IMHO Cathy Wood is the female equivalent of Jim Cramer.
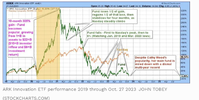
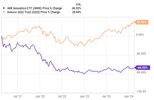
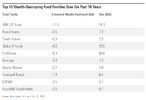
One look at the ARK chart is enough for me to treat he with a fair bit of skepticism.
Mick
