Australian (ASX) Stock Market Forum

All Cashed Up and Nowhere To Go

luckily, extra-bourse activities have seen me sit, and sit, and wait and watch, of late. At least the accumulating dosh, with dividend flows adding to the balance, is earning some interest. Am finding little that may not be cheaper soon.

For many, the higher for longer rates reality hasn't really sunk in, nor froth associated with ideas that may not execute to implementing.
but that was Sept. Late Nov, the boring fund added to 2 LICs. And the last few days, rats n mice are being driven from the property.

A side hustle is occupying my time, and the weather's nice.
 
When was it made?

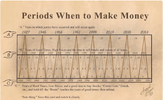
How The Benner Cycle Predicts 100+ Years of Market Movement


Samuel Benner was a farmer from the 1800s who wanted to understand how market cycles worked. In 1875, he published a book forecasting business and commodity prices. He identified years of panic, years of good times, and years of hard times.

Panic Years: These are years when the market panicked, either buying or selling a stock irrationally until its price skyrocketed or plummeted beyond anyone’s wildest expectations.

Good Times: Years Benner identified as times of high prices and the best time to sell stocks, values, and assets of all kinds.

Hard Times: In these years, Benner recommends buying stocks, goods, and assets and holding them until the “boom” years of good times, then unload.


100+ Years of “Sure Thing”

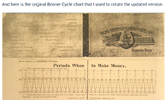
At the bottom of his card, Benner wrote “Sure thing.” and for 100 years he’s been close to perfect. As a prosperous Ohio Farmer, the 1873 market panic was a blow for Samual Benner, and it wiped him out. When trying to understand why this happened, Benner discovered the notion of market cycles.

As a farmer, Samuel knew that the seasonal cycles affected crops, which then affect supply and demand, which affects the price. Benner looked deeper into these cycles and found an 11-year cycle in corn and pig prices with peaks every 5/6 years. This matches the 11-year solar cycle. Benner figured that this solar cycle affects crop yield, affecting revenue, supply/demand, and price.
 
and the pivotal question is , will this chart ( whether real or fake ) keep working in our lifetime ??
I think the main thing to take away from the chart is that most traded commodities have a supply and demand phase and that the price fluctuates with these phases.

Trying to time or understand the exact time of the phasing is very difficult and is a science in itself. You could dig in a bit further and then look at over and undersupplies. A good example would be the current housing market in Australia with under-supply and you then have lithium stocks falling with over-supply in the market.
 
Top