Australian (ASX) Stock Market Forum

Gold Price - Where is it heading?

Below is some Technical Analysis on the Gold market. He doesn't do TA the same way I do it but this man made his fortune mainly trading gold miners and gold, so his experience would give him a good feel for this market.

Gold Could Start 2025 With a Bang
By Jeff Clark, editor, Market Minute
It’s still not quite time to buy gold and gold stocks.

The correction in the gold market, which started when the Gold Bugs Index (HUI) peaked above $350 in mid-October, still has more work to do on the downside.

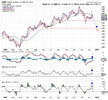
Look at this updated chart of HUI…
20241218-JMU-01.jpg

It has been more than one month since we last looked at this chart. Back then, we noted that gold stock corrections typically unfold in three distinct phases.

There’s the first decline phase, followed by an oversold bounce, which is then followed by another decline phase.

Last month, we suspected the gold sector was near the end of the first decline phase and was setting up for an oversold bounce. And, that’s what we got. HUI bounced off the support line near $290 and rallied all the way back up to test the resistance of the 50-day moving average line at about $312.

Now it looks like the gold sector is starting phase three.

And that’s a decline to a lower low that exhausts the selling pressure and sets the stage for a new, intermediate-term rally phase.

The Next Phase in the Gold Correction​

If it unfolds as I expect it to, then once HUI breaks below its November low – near $290 – it’s likely headed to the next support line at about $260.

That’s where I’ll be looking to buy back into the gold sector – aggressively – especially if all the momentum indicators at the bottom of the chart can hold above their mid-November lows.

Regular readers know that I am a big fan of buying into trade setups that show “positive divergence.” (It’s all part of my Magic Pattern – check it out right here.)

So, if HUI declines to a lower low while the momentum indicators all make higher lows, we’ll have the exact setup that I prefer.

Right now, though, I’m not buying anything in the gold sector. It’s still too early.

But, keep an eye on the above chart over the next few weeks. If it plays out as I’ve described, then the gold sector could be set up for an excellent start to 2025.

Best regards and good trading,
jeff-clark-signature.png

Jeff Clark
Editor, Market Minute
 
Below is some Technical Analysis on the Gold market. He doesn't do TA the same way I do it but this man made his fortune mainly trading gold miners and gold, so his experience would give him a good feel for this market.

Gold Could Start 2025 With a Bang
By Jeff Clark, editor, Market Minute
It’s still not quite time to buy gold and gold stocks.

The correction in the gold market, which started when the Gold Bugs Index (HUI) peaked above $350 in mid-October, still has more work to do on the downside.

Look at this updated chart of HUI…
View attachment 189735

It has been more than one month since we last looked at this chart. Back then, we noted that gold stock corrections typically unfold in three distinct phases.

There’s the first decline phase, followed by an oversold bounce, which is then followed by another decline phase.

Last month, we suspected the gold sector was near the end of the first decline phase and was setting up for an oversold bounce. And, that’s what we got. HUI bounced off the support line near $290 and rallied all the way back up to test the resistance of the 50-day moving average line at about $312.

Now it looks like the gold sector is starting phase three.

And that’s a decline to a lower low that exhausts the selling pressure and sets the stage for a new, intermediate-term rally phase.

The Next Phase in the Gold Correction​

If it unfolds as I expect it to, then once HUI breaks below its November low – near $290 – it’s likely headed to the next support line at about $260.

That’s where I’ll be looking to buy back into the gold sector – aggressively – especially if all the momentum indicators at the bottom of the chart can hold above their mid-November lows.

Regular readers know that I am a big fan of buying into trade setups that show “positive divergence.” (It’s all part of my Magic Pattern – check it out right here.)

So, if HUI declines to a lower low while the momentum indicators all make higher lows, we’ll have the exact setup that I prefer.

Right now, though, I’m not buying anything in the gold sector. It’s still too early.

But, keep an eye on the above chart over the next few weeks. If it plays out as I’ve described, then the gold sector could be set up for an excellent start to 2025.

Best regards and good trading,
View attachment 189736

Jeff Clark
Editor, Market Minute
I feel the same, too early to jump back again..i can hardly wait
 
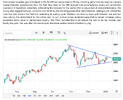
Looks like Low has come in one day past the target date with price on an important degree. Buying at current levels and if we move higher we could see Top into X so we will need to maintain above Dec 18th to qualify this Cycle.
 

Attachments

  • ddg.png
    ddg.png
    119.8 KB · Views: 4
While 99% of the media keeps staring at official data by the Chinese central bank (PBoC)—misleadingly stating it added 5 tonnes of gold in November following a supposed six-month pause—the PBoC’s "unreported" purchases in London accounted for a stunning 60 tonnes in September and another 55 tonnes in October.

And while cross-border trade statistics from the U.K. for November have yet to be released, I foresee another purchase of a similar magnitude.

Chinese authorities see a greater role for gold in the future international monetary system, or they wouldn’t continue buying such extraordinary amounts of gold. Via London alone, the PBoC has stockpiled 1,000 tonnes of gold since Russia’s foreign exchange assets were “frozen” by the West early 2022.

London Exports to China Are a Proxy for PBoC Buying

Since July this year, I have been writing that a large share of China’s gold imports into the domestic market is not bought by the private sector. We can conclude that the bars exported from the U.K. to China are secretly destined for the PBoC.

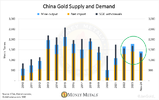
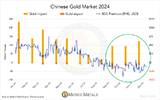
Initially, I based my analysis on a pronounced surplus in the Chinese domestic gold market—resulting from supply (mine, recycled gold, and imports) outstripping demand. The most conceivable explanation for this surplus is that the central bank of China is behind large gold imports.

ges%2Fd6cd30bc-8f29-4c4f-be71-25632c562751_800x504.png
Chart 1. From 2022 until November 2024 there is a surplus in the Chinese gold market, because import and domestically mined gold was more than SGE withdrawals.

My findings became more evident when in September the premium on the Shanghai Gold Exchange (SGE) turned negative, but Chinese gross imports accounted for a sturdy 95 tonnes for the month.

It makes no economic sense for any bullion bank to buy gold abroad and sell at a loss at the SGE. The 60 tonnes (in 400-ounce bars) exported in September from the London Bullion Market to China went to the vaults of the PBoC in Beijing, I therefore concluded.

The PBoC Keeps Up the Pace, Buying 55 Tonnes in October

I noted the following in my last article:

…we can see that in October, the SGE was trading at a discount while imports reached 95 tonnes, which was the same as in the prior month. I strongly suspect the PBoC was secretly buying gold in London again.
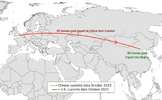
Recent data by Her Majesty’s Revenue & Customs (HMRC)—Britain’s tax, payments and customs authority—reveal 55 tonnes were indeed dispatched from the London region to China in October.

ges%2F7b48bec6-6528-4105-a28f-20a9183089d6_800x496.png
Graph 2. Courtesy of Wikimedia for the map.

Meanwhile, it’s likely the PBoC also bought gold elsewhere. Total imports into the Beijing region accounted for 69 tonnes in October, as per General Administration of Customs People's Republic of China. That’s 14 tonnes more than what was shipped from London.

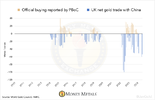
An illustration I shared previously is a chart of the PBoC’s publicly disclosed gold purchases versus U.K. gold exports to China. The chart shows both are loosely correlated "although the PBoC usually takes up to a year to publicly report its acquisitions and keeps about 65% of it hidden" (quote from my article from November 26, 2024).

ges%2F79f387a9-94cf-4826-8a8d-cf38a0967058_800x519.png
Chart 3. The PBoC’s publicly disclosed gold purchases versus U.K. gold exports to China that serve as a proxy for covert buying by the Chinese central bank.

Only two months after September (when the PBoC covertly resumed buying in London), it revealed to the world it bought a mere 5 tonnes in November. Even this fraction of the truth boosted sentiment in the gold market.

The Chinese central bank is currently buying at least ten times more gold than what you read in the newspaper, and yet markets got excited based on mere breadcrumbs!

Goldman Sachs Writes on PBoC Gold Buying in London

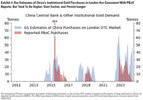
Meanwhile, my research is gaining traction as it was picked up by Goldman Sachs (GS). Below you can see a chart by GS displaying what I first demonstrated in July, but with a different design.

ges%2Fe8b217ec-200c-4f20-af5f-1994dce9a6b8_652x459.jpg
Chart 4. Courtesy of Goldman Sachs.

At the bottom it reads "our estimate of Chinese central bank … purchases on the London OTC market is based on UK exports of large bars to China, as reported by UK customs (HMRC)." (Parroting my own conclusion.) Eventually other media will start writing about these huge purchases as well.

For me, this topic reminds me of my early work analyzing SGE withdrawals. In 2013, I began spotlighting the volumes of gold withdrawn from SGE vaults, documenting why that is a proxy for Chinese wholesale demand. By implication, gold demand in China at the time was twice what consultancy firms stated. A few years later, nobody argued about the meaning of SGE withdrawals anymore.

Gold’s Role in the International Monetary System Will Increase

In November, gold on the SGE was still trading at a discount, yet Chinese gross gold imports swelled to 122 tonnes. No doubt the PBoC struck big in the London Bullion Market once again.

ges%2F60225229-0c3c-4eaf-982e-1b42fb84460f_800x500.png
Chart 5. The Chinese central bank orders gold abroad at bullion banks and outsources transport to Beijing to those banks, making them have to register the metal at customs.

My latest estimate of the PBoC’s true gold holdings is roughly 5,000 tonnes, a number that is in stark contrast to what the Chinese divulge to the IMF, i.e. 2,271 tonnes. (I will substantiate my estimate in a follow up article.)

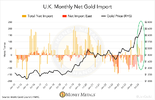
Tellingly, it seems some large investors in the West are sniffing out the momentous developments in the gold market. Although the U.K. was a gross exporter of 55 tonnes to China in October, the U.K. itself net imported 110 tonnes.

Who bought? Most likely institutional money as ETF holdings stored in London increased by only 18 tonnes, according to statistics compiled by friend and data wrangler Nick Laird from GoldChartsRUs.com.

ges%2Fbb35b878-d621-43c4-ba27-6ee72df7ddd1_800x519.png
Chart 6. Western institutional money must be buying gold too, because London inflows are substantial. As an aside, HMRC’s numbers show mostly mining countries exported to the U.K. (Australia, Canada, Kazakhstan, South Africa, United States, Uzbekistan), next to Germany, Singapore, and Switzerland.

These are exciting times indeed for gold.

China’s monetary authority doesn’t buy gold for no reason at a pace of approximately 60 tonnes a month from Great Britain alone—now 1,000 tonnes in total since the war in Ukraine. The Chinese obviously see a greater role for gold in the international monetary system going forward.

Over the same 30-month period, the value of China’s holdings of U.S. Treasuries has declined by $250 billion.

What we’re witnessing a shift from "dollar recycling"—the status quo from 1971 through 2021—to "gold recycling." Instead of investing trade surpluses in dollars, countries are increasingly choosing for gold.

The Saudi central bank is also buying gold under the radar, next to many central banks buying openly.

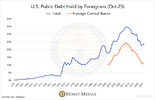
As a result, less and less of the U.S. its excessive public debt (122% of GDP) is financed by foreigners, let alone foreign central banks. This forces Treasury to either reduce the fiscal deficit (currently 6% of GDP, good luck!), pay higher interest rates and accelerate the debt spiral, or print its way out of this through inflation.

In addition to dollar weaponization, the (global) debt overhang is a motive for central banks to increase their gold reserves, as historically inflation is the most common big way of restructuring debts.

ges%2Fa698cf71-8e4a-48a7-a5bb-fb20488b0981_800x519.png
Chart 7. The U.S. public debt is unsustainable.

jog on
duc
 
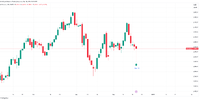
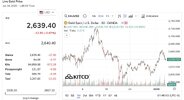
The November Trump pullback is in the rear view mirror and gold has been toying with $2580 - $2720 since. Those of us hoping for a retracement to $2500 hoping to add have been disappointed. There are just too many of us LOL of a similar mind. Which goes to show imo that a new base has formed for Gold and that the commentators discussing $3000 this year and even $10,000 this decade may be proven to be not far off the mark.

The BRICS crew are looking sad and sorry geopolitically but are still intent on forming a currency to tackle the $USD based on Gold. We shall see.

Not much to report on the chart, but at a glance buy at $2600 and sell at $2700 has been a good bet recently. I'm back in and thanks to the $AUD falling and the rise in Gold am creeping ahead with the new lot.


1735973568095.jpeg

gg
 
Top